PostgreSQL cardinality estimation quality 2018-06-01
When PostgreSQL optimizes a query, it needs to estimate the number of tuples that each node of the query plan will have to handle: the cardinality of the node.
The estimate the optimizer made, and the actual number of tuples, can be seen using EXPLAIN ANALYZE:
EXPLAIN ANALYZE SELECT * FROM orders WHERE netamount > 100;
                                                    QUERY PLAN
----------------------------------------------------------------------------------------------------------
 Seq Scan on orders  (cost=0.00..250.00 rows=8893 width=30) (actual time=0.035..17.633 rows=8897 loops=1)
   Filter: (netamount > '100'::numeric)
   Rows Removed by Filter: 3103
 Planning Time: 0.332 ms
 Execution Time: 21.807 ms
(5 rows)
The example queries are run on the dellstore2 dataset.
As you can read in the rows= parts of the query execution plan, the optimizer estimated that 8893 tuples would match the predicate; actually 8897 did.
This number was estimated using the statistics it stored on the column: the process is explained in the docs.
This discrepancy between the estimated and actual cardinality can be measured, for example using the q-error, that is described in this research paper. It is the ratio between actual and estimated cardinalities for an underestimation, and its inverse for an overestimation, so that the q-error is always higher than 1. In the previous example, the q-error was very low (~1), but if the data contains correlations, things can get messy:
                                               QUERY PLAN
--------------------------------------------------------------------------------------------------------
 Seq Scan on orders  (cost=0.00..280.00 rows=189 width=30) (actual time=0.025..9.297 rows=1158 loops=1)
   Filter: ((netamount > '360'::numeric) AND (totalamount > '360'::numeric))
   Rows Removed by Filter: 10842
 Planning Time: 0.187 ms
 Execution Time: 10.688 ms
(5 rows)
In this example, netamount and totalamount are obviously correlated, but the planner does not know that: it assumes independence between the attributes, and simply multiplies the estimated selectivity of the two predicates (the fraction of tuples they match), to get the selectivity of the node. In this case, the q-error is 6.12. With more joins and more columns involved, the q-error can easily reach several orders of magnitude, which can lead the optimizer to make wrong choices for the query plan, such as choosing a nested loop join over a hash join because it assumes the input relations are small. The query would then perform much slower than could be expected.
I have written a script to visualize the impact of those estimation errors, which is available here. Here are some of the plots it can generate, when run against a database containing the IMDb dataset with the JOB benchmark, introduced in this research paper (the same one as before).
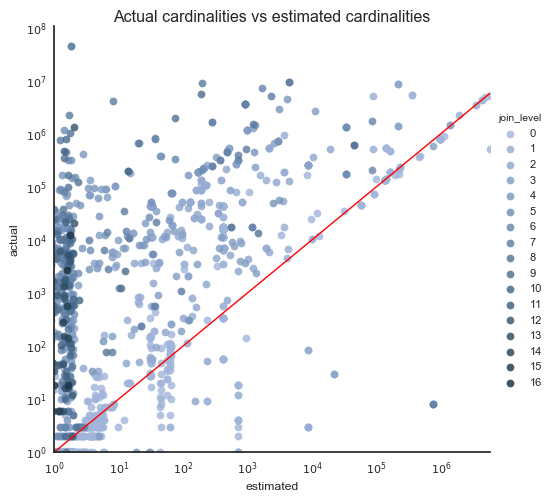
This plot shows, for each plan node of each query, how good the cardinality estimation was. The closer to the red line the data point is, the better the estimation was. Above the line are underestimates, under the line are overestimates. As you can see, underestimates are much more common than overestimates.
The color represents the depth of the join tree under the plan node: the darker the data point, the deeper the join tree. Notice that darker data points (so deeper join trees) have bigger estimation error.
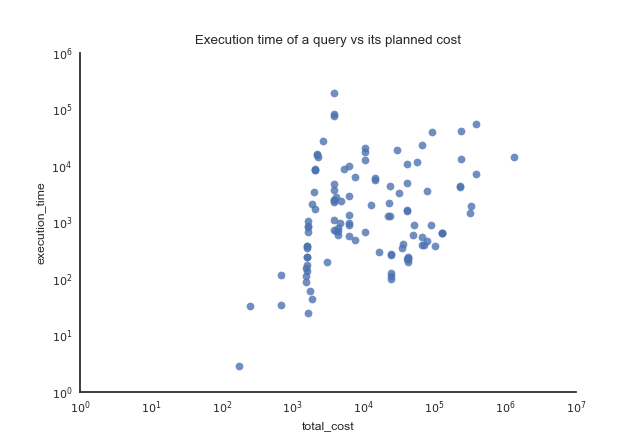
This plot shows the execution time of a query against its cost estimated by the optimizer. Pay attention to the log scales: some queries have execution times several orders of magnitude higher than other queries with a comparable estimated cost. The queries were run on a server that did nothing else, and both the postgres cache and the system cache were dropped prior to running the queries.
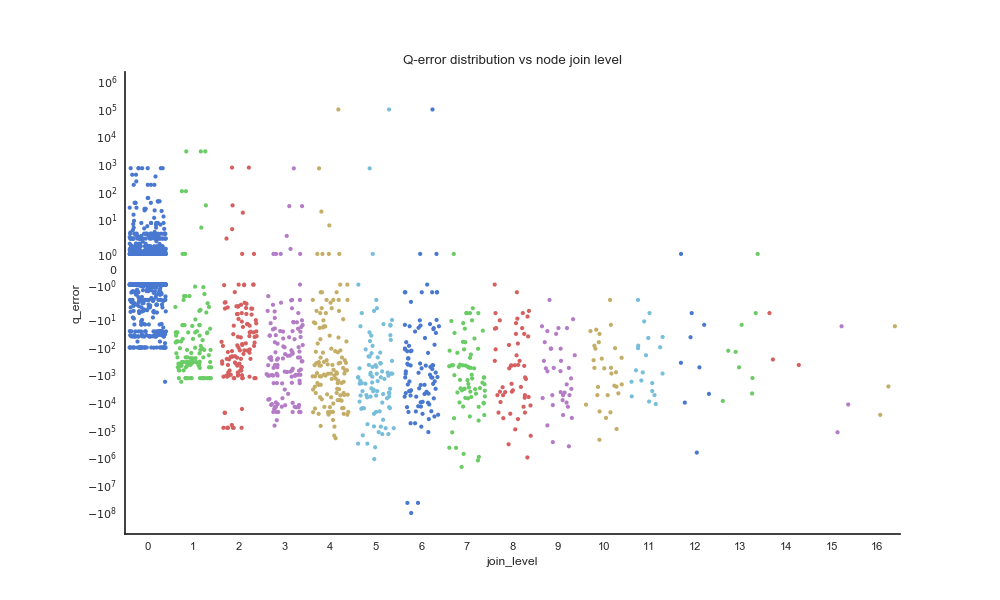
This plot shows the q-error distribution of query plan nodes, grouped by join tree depth. We can see that most of the overestimation happens at join level 0 (no join); there are very few overestimations when joins are involved. It also confirms that high estimation errors are very common.
This tool is open to contributions and discussion.